

Key Takeaways
Consumer Price Index (CPI)
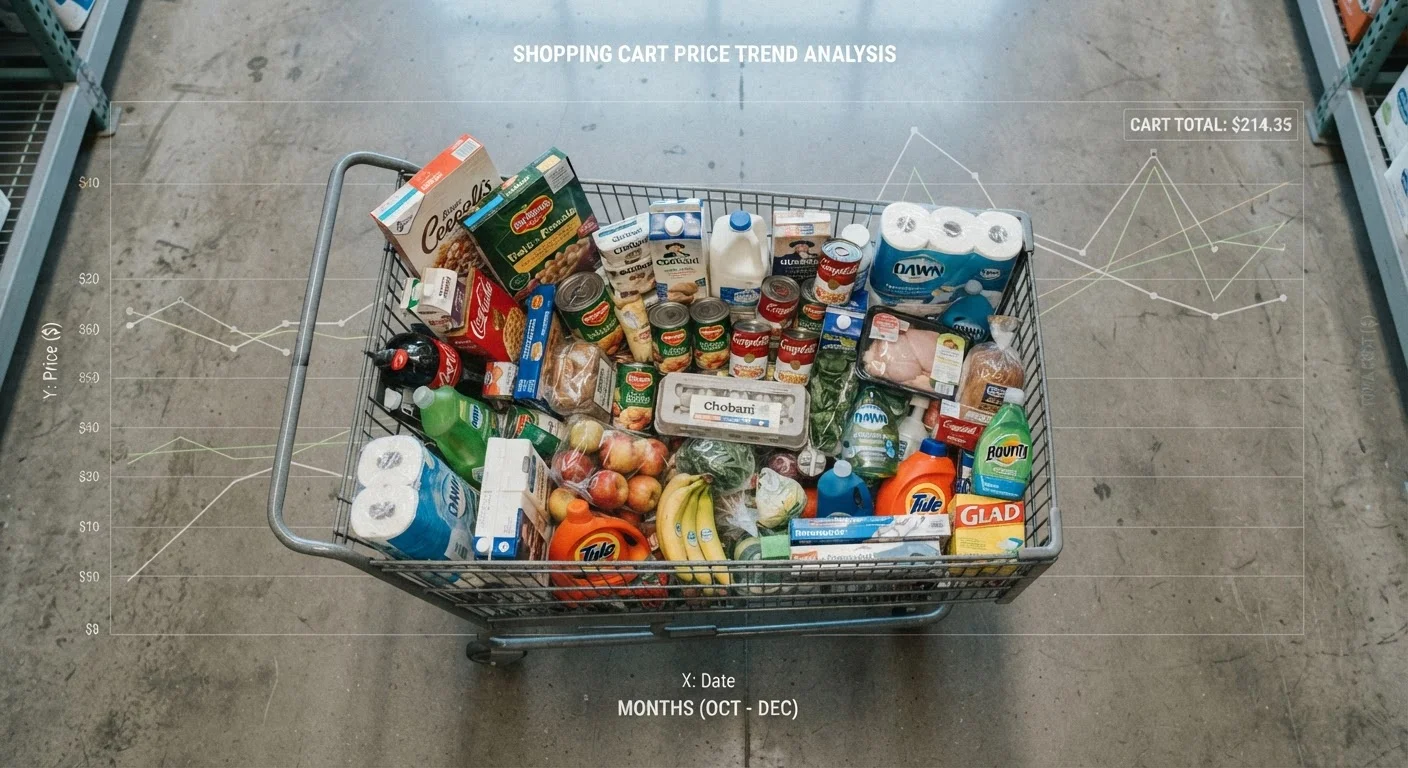
The Consumer Price Index is a monthly measure published by the U.S. Bureau of Labor Statistics (BLS) that tracks how much prices have changed for a representative basket of goods and services that urban consumers typically buy. It is the most widely cited inflation gauge in the United States, used to adjust Social Security benefits, federal tax brackets, and wage contracts. When the CPI rises, it generally means everyday costs are going up; when it falls, prices are declining on average.
The BLS publishes several CPI variants, including CPI-U (all urban consumers) and CPI-W (urban wage earners and clerical workers). The Federal Reserve's preferred inflation measure is actually the Personal Consumption Expenditures (PCE) price index, which uses a different methodology and weighting system.
How the BLS Builds the Basket
Each month, BLS data collectors contact thousands of retail stores, rental units, hospitals, and service providers across the country to record actual prices. Those prices feed into a carefully weighted index representing the spending habits of approximately 93 percent of the U.S. population - specifically, urban and metropolitan consumers.
The basket is divided into eight major categories: food and beverages, housing, apparel, transportation, medical care, recreation, education and communication, and other goods and services. The weights assigned to each category reflect how much of their income consumers actually spend on that category, based on the Consumer Expenditure Survey. Shelter alone accounts for roughly 34 percent of the total index - the single largest component by far.
The BLS periodically revises these weights as spending patterns shift, most recently updating them annually rather than every two years. For a broader look at how economic indicators are constructed and what each one signals, see our guide to economic indicators worth watching.
~34%
Share of CPI represented by shelter costs
According to the Bureau of Labor Statistics, the shelter component - including rent and owners' equivalent rent - is the largest single category in the CPI-U weighting structure.
93%
Share of U.S. population the CPI-U represents
The CPI-U is designed to reflect spending patterns for all urban consumers, covering the majority of the American population but excluding rural residents.
12+
Months OER can lag actual market rents
Research from economists at institutions including the San Francisco Federal Reserve has documented significant lags between market rent changes and their reflection in the CPI's owners' equivalent rent measure.
The Housing Problem: Why OER Lags Reality
The CPI's most debated component is how it handles housing costs. Because most homeowners don't pay rent to themselves, the BLS uses a concept called owners' equivalent rent (OER) - essentially asking homeowners what they think they could rent their home for. This figure is then used as a proxy for the shelter costs of owner-occupied homes.
OER is based on surveys and tends to respond slowly to real-market conditions. During the 2021-2023 period when market rents spiked sharply, OER took many months to reflect those increases, causing the CPI to temporarily understate actual housing cost pressure. Conversely, when rents cool, OER can keep pushing the index higher long after market prices have softened. This structural lag is widely acknowledged by BLS and outside economists alike.
If you want context on how housing data can mislead in other ways, see why median home price figures have real blind spots.
What the CPI Misses for Many Households
The headline CPI is an average - and averages conceal enormous variation. Several groups consistently experience inflation differently than the index suggests:
- Lower-income households spend proportionally more on food and energy - categories that often experience sharper price swings. Since these households have less budget flexibility, even modest price increases carry greater real-world impact.
- Older Americans typically spend a larger share of income on healthcare. The BLS publishes a separate experimental index called the CPI-E, which has historically shown higher inflation for this group than the standard CPI-U.
- Rural residents are excluded from the CPI entirely - the index covers urban consumers only, meaning Americans in small towns and rural areas have no official price index tailored to their spending patterns.
- Renters in high-cost metros may face rent increases well above what OER captures, especially during rapid market upswings.
These gaps don't mean the CPI is broken - they mean it should be read as a national average, not a personal financial report. For a deeper look at how affordability metrics diverge from lived experience, explore how economists and everyday buyers think about affordability differently.
The CPI-E: An Index for Older Americans
Since 1987, the Bureau of Labor Statistics has published an experimental index called the CPI-E, which reweights the standard basket to reflect the typical spending patterns of Americans aged 62 and older. Because older consumers spend more on medical care and less on education and transportation, the CPI-E has historically shown a somewhat higher inflation rate than the CPI-U. Congress has periodically debated whether to use the CPI-E - rather than the CPI-W - to calculate Social Security cost-of-living adjustments, though no change has been enacted as of this writing.
Reading CPI Headlines With More Precision
When a news report says "inflation rose 3.2 percent," that figure is the year-over-year change in the headline CPI-U. A few habits can help decode what that number actually means:
- Check core vs. headline. Core CPI excludes volatile food and energy prices and gives a cleaner read on underlying inflation momentum.
- Look at category-level data. The BLS releases detailed breakdowns showing which specific categories drove the monthly change - a rise led by used car prices tells a different economic story than one led by medical services.
- Compare to PCE. The Federal Reserve's preferred PCE index adjusts for consumer substitution and often reads differently than CPI, especially at turning points in inflation cycles.
Skepticism about official inflation figures is common, and some of it is grounded in legitimate methodological debate. A closer look at common misconceptions about how inflation is calculated separates valid criticism from unfounded claims.
This article is for informational and educational purposes only and does not constitute financial or economic advice. Readers should consult qualified financial professionals for guidance specific to their personal circumstances.